
WHERE IT'S BREAKING
KPI Dashboard and Management Reporting
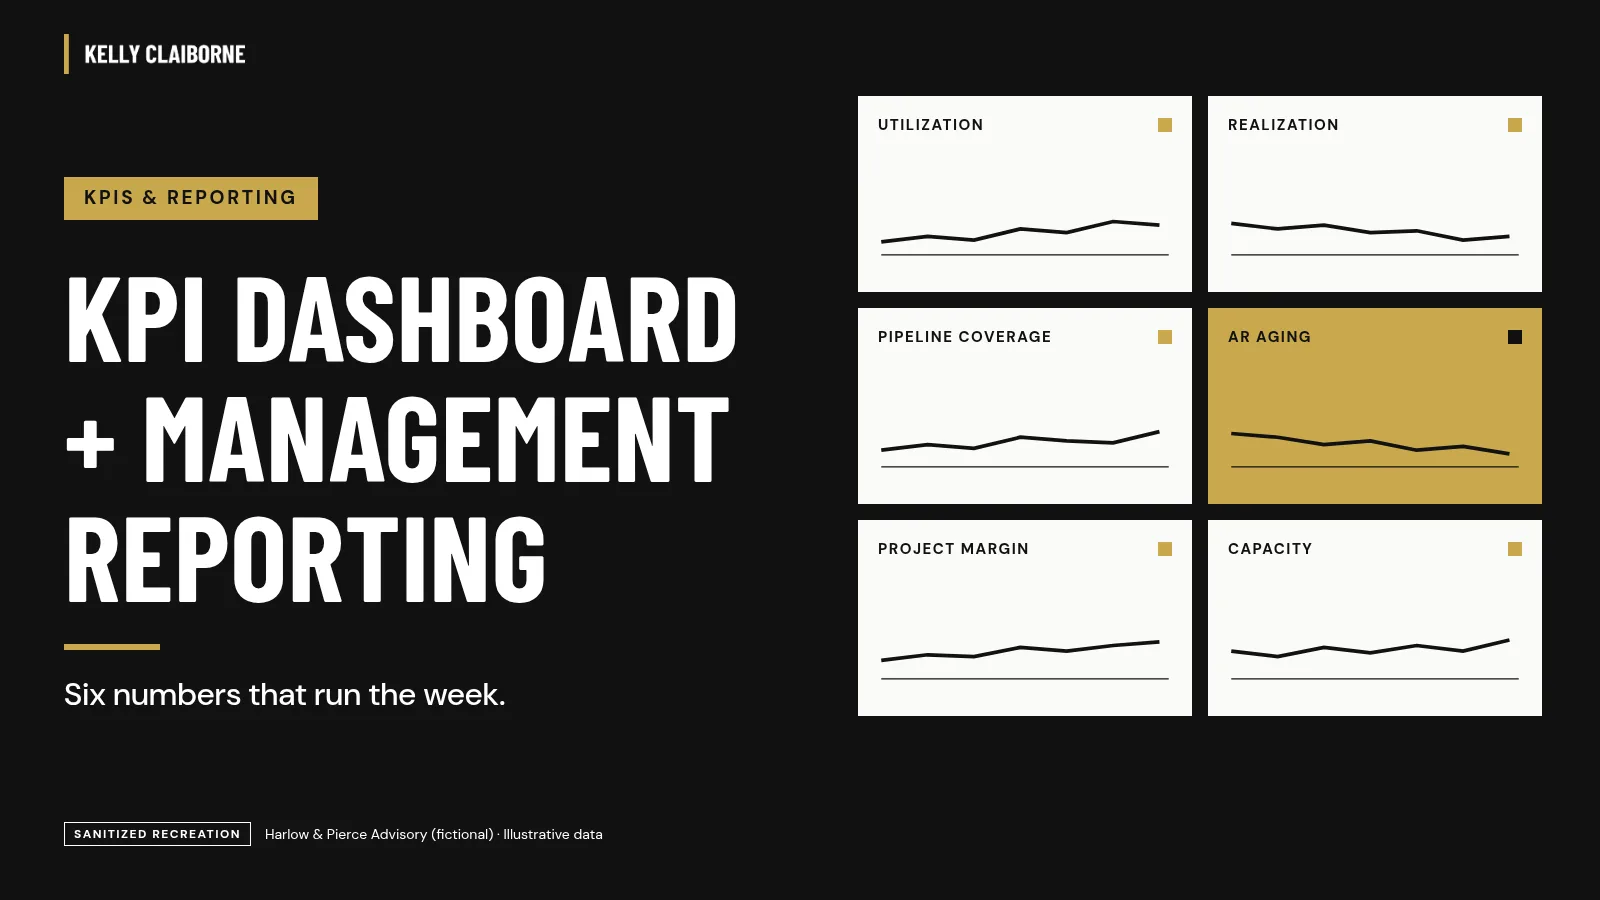
A dashboard full of numbers is not management reporting. This one starts with the decisions leadership makes, picks six KPIs with written definitions, maps each to its source system, and builds a one-page dashboard, a monthly pack that ends in decisions, and a weekly, monthly and quarterly reporting rhythm.
What it looks like
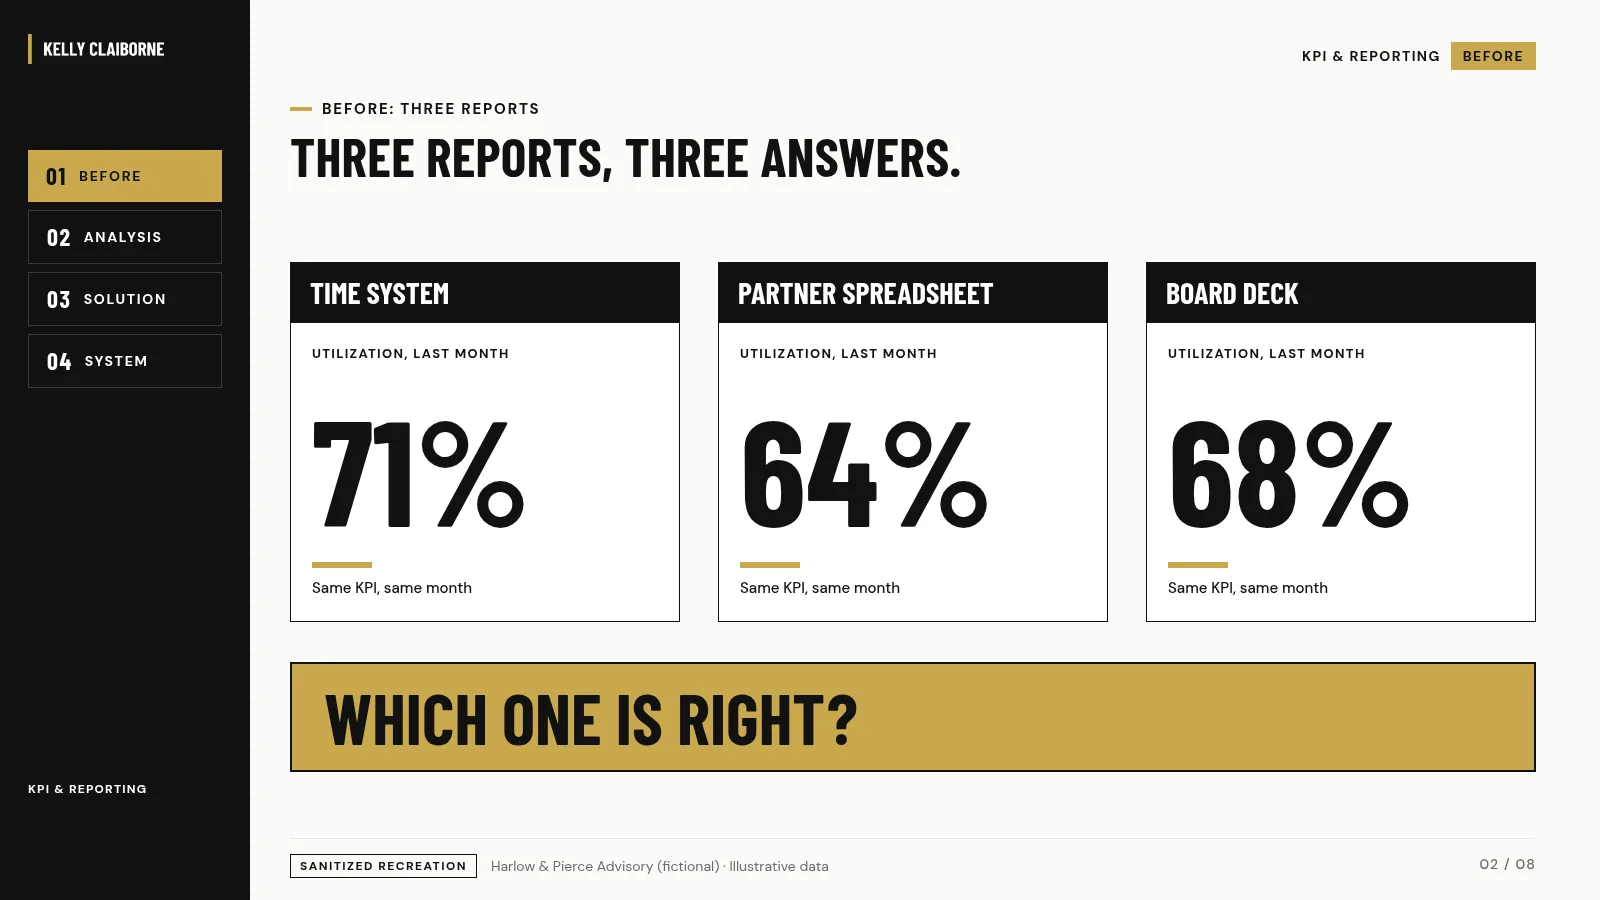
- The same metric is calculated three ways in three places.
- Project margin is known after a project closes, not while it runs.
- Monthly reports are built by hand over several days and read by few.
- Meetings spend the first half of the hour reconciling numbers. Nobody owns data quality.
The ask:“Give me one page I trust on Monday morning, and a monthly pack that tells me what to decide.”
How I'd work through it
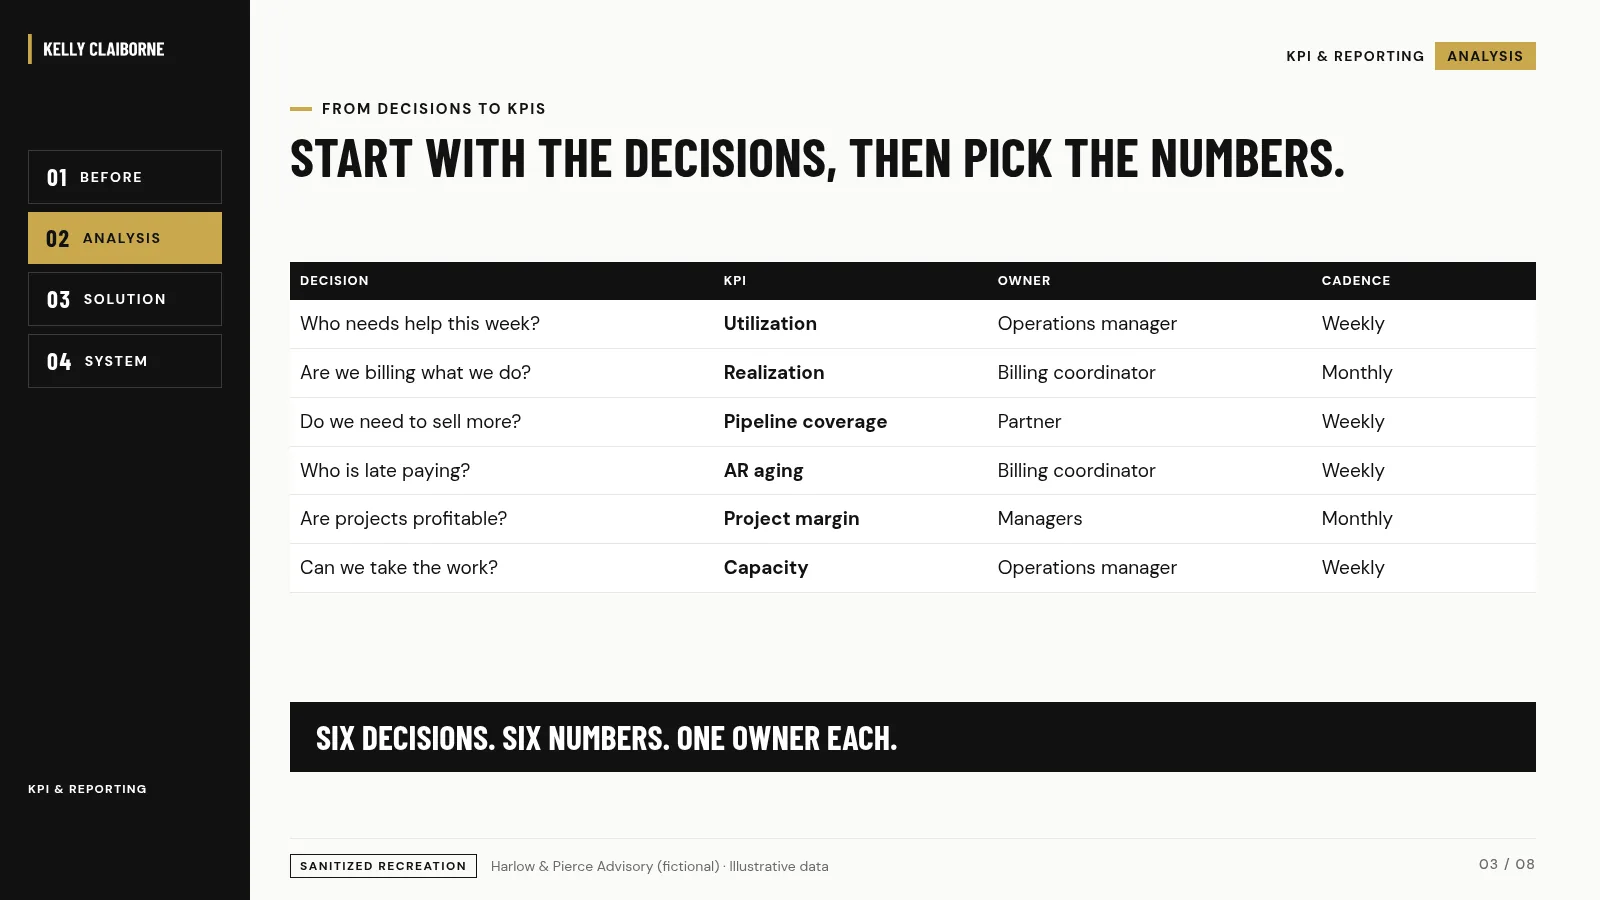
- Start with the decisions. Each KPI exists to inform one of them.
- Pick few KPIs and name one owner for each.
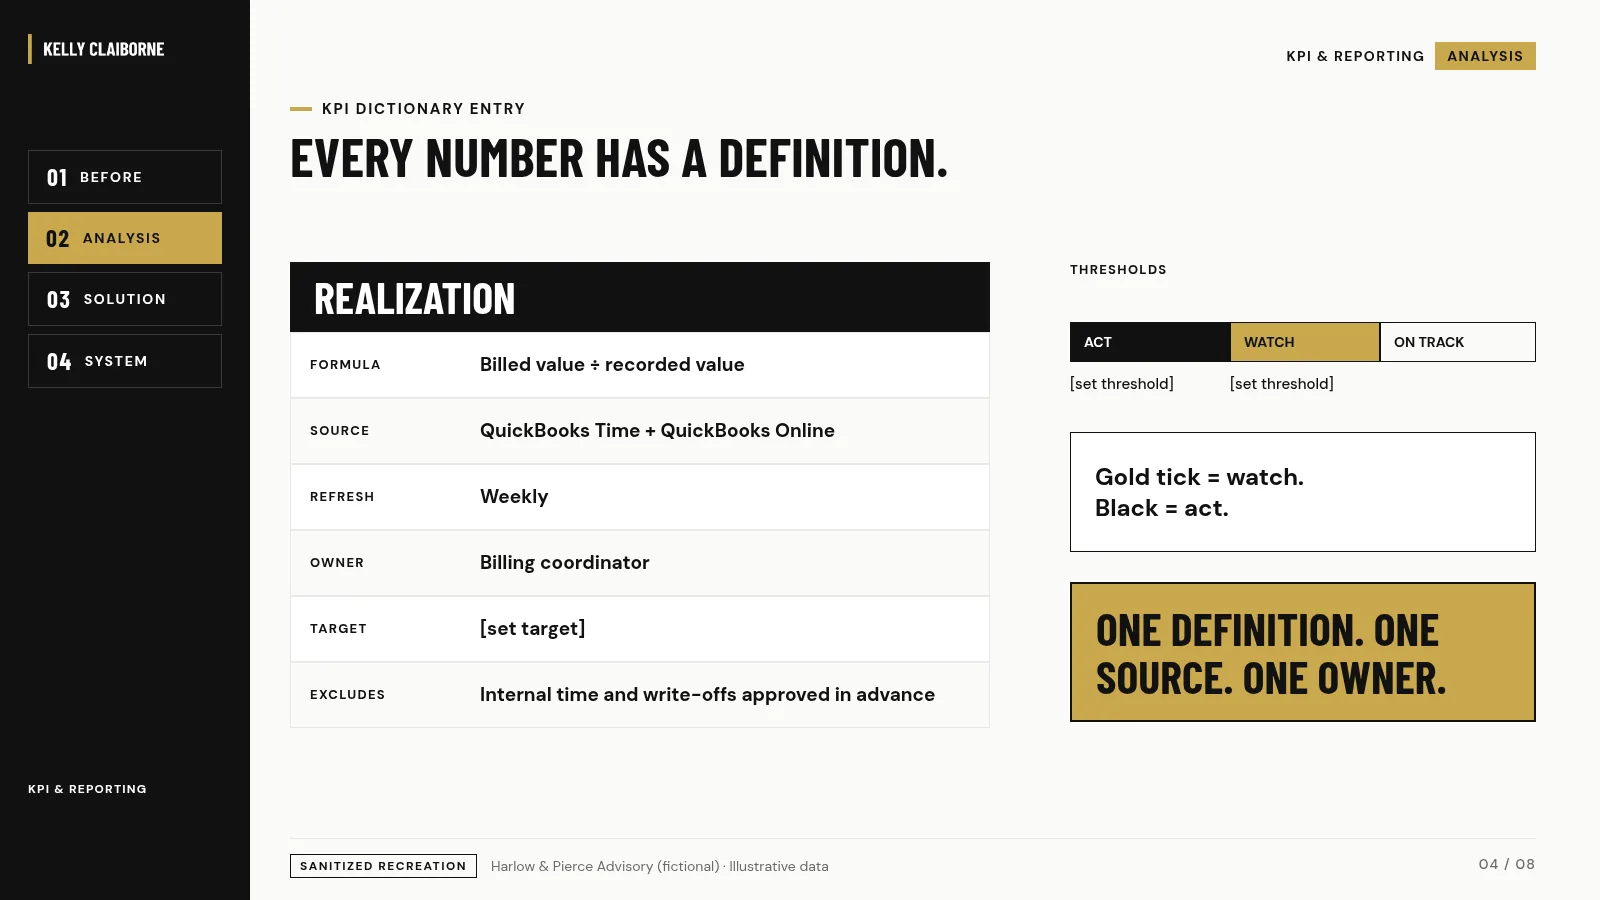
- Write a definition for every KPI: formula, source, refresh, owner and what counts as “watch” or “act.”
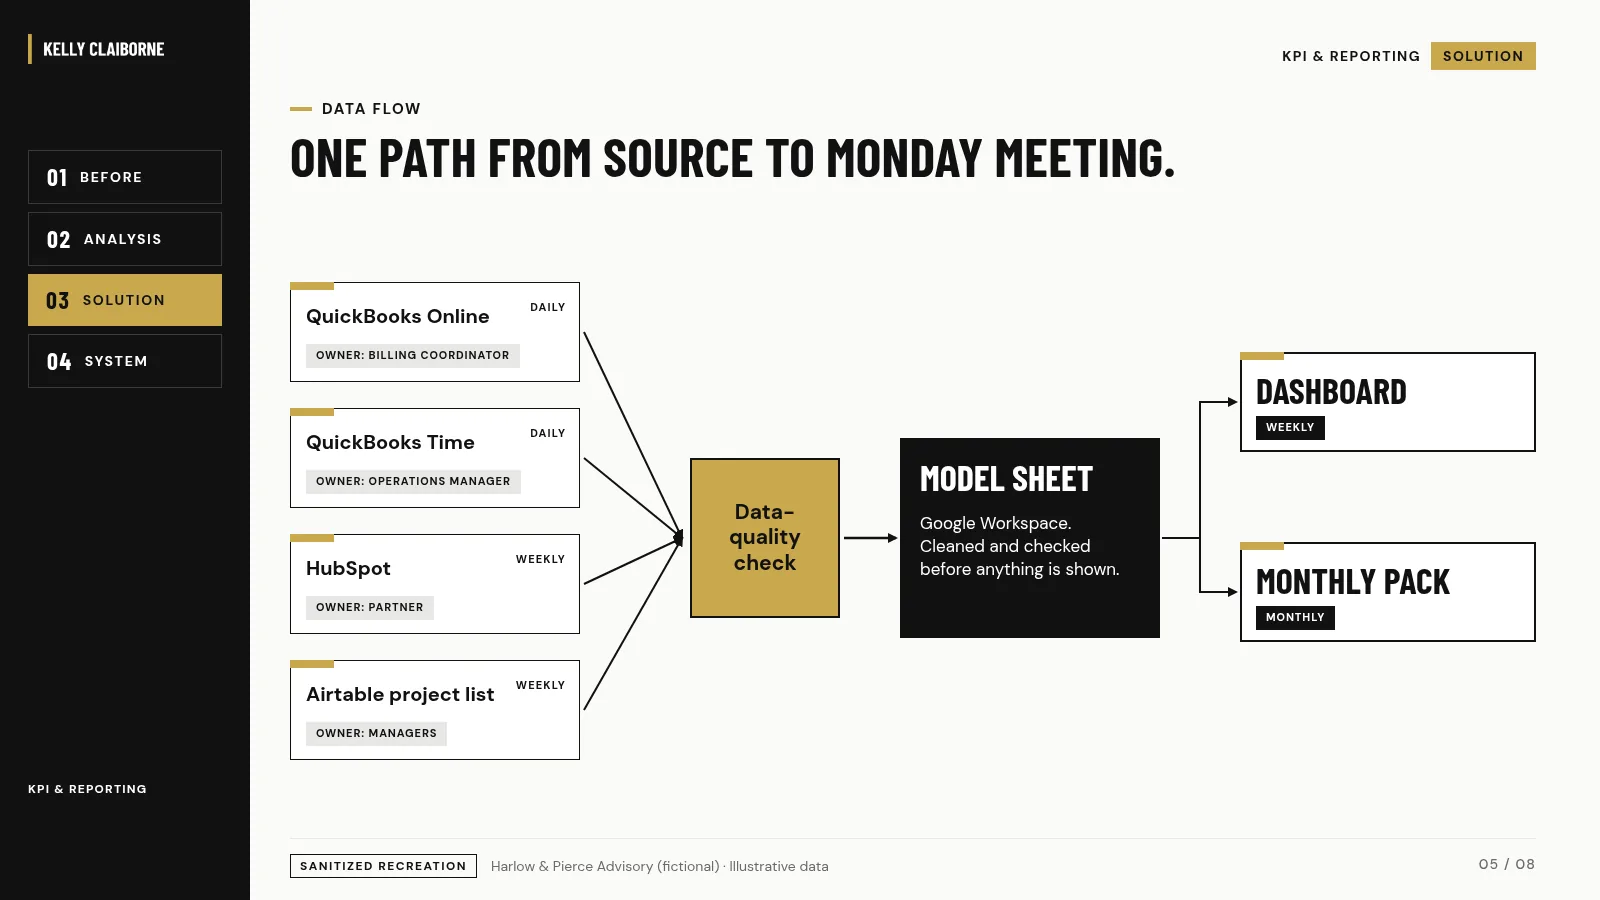
- Map the data flow from source systems to a cleaned model to the dashboard.
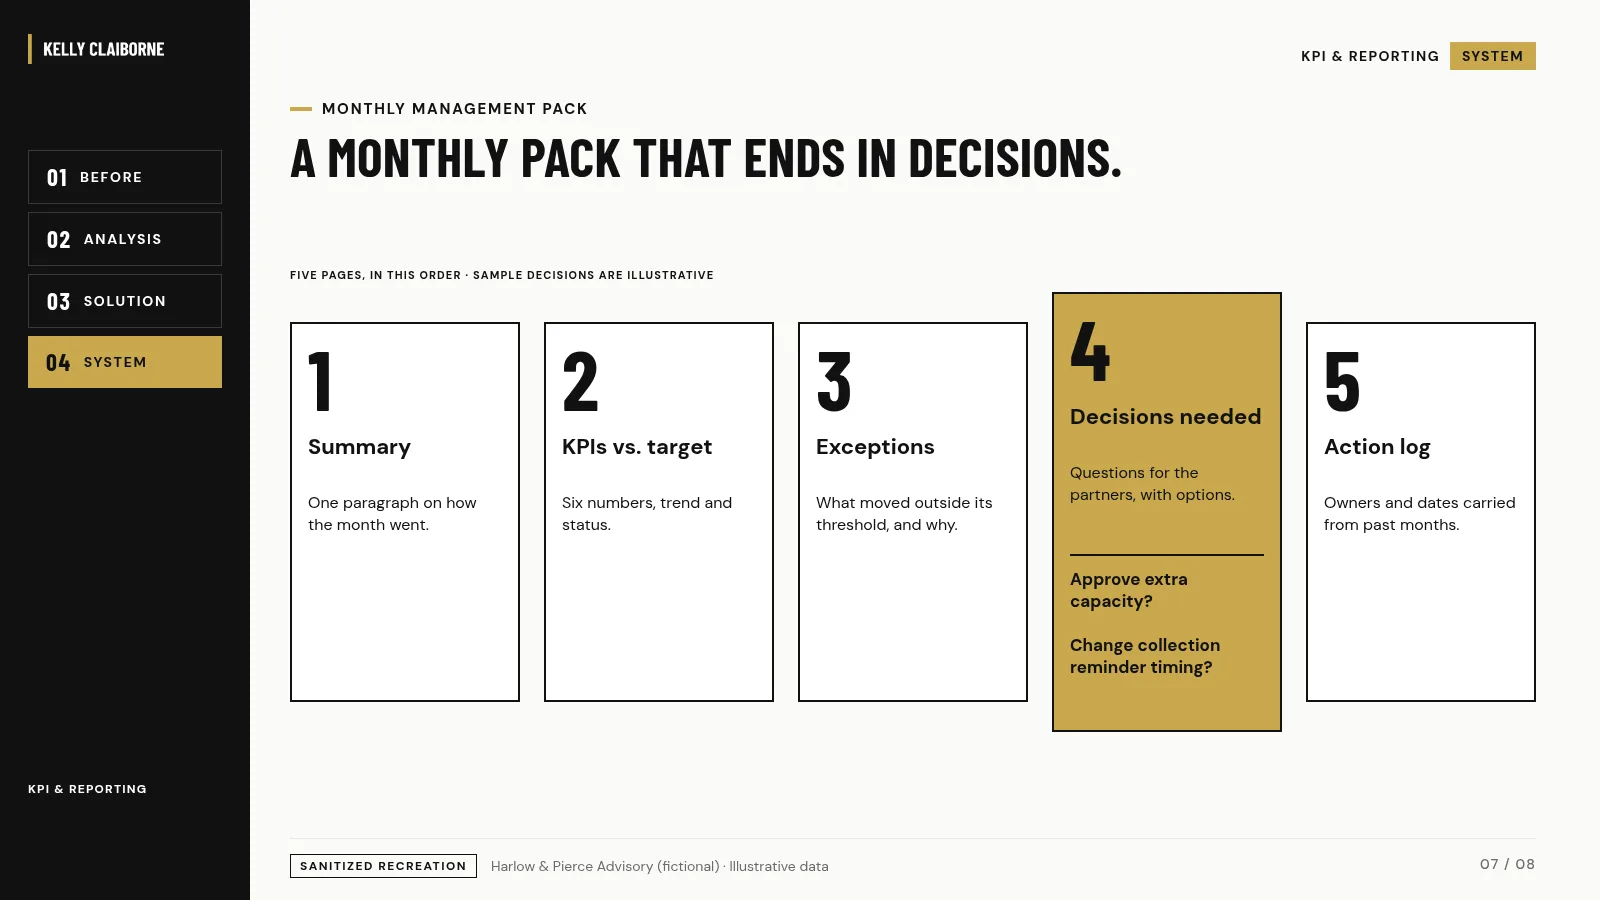
- Build the monthly pack to end in decisions and actions, not just charts.
- Keep it maintainable with a refresh guide and a monthly data-quality check.
What gets built
- Decision-to-KPI map
- KPI dictionary (one page per KPI)
- Data-flow diagram and source map
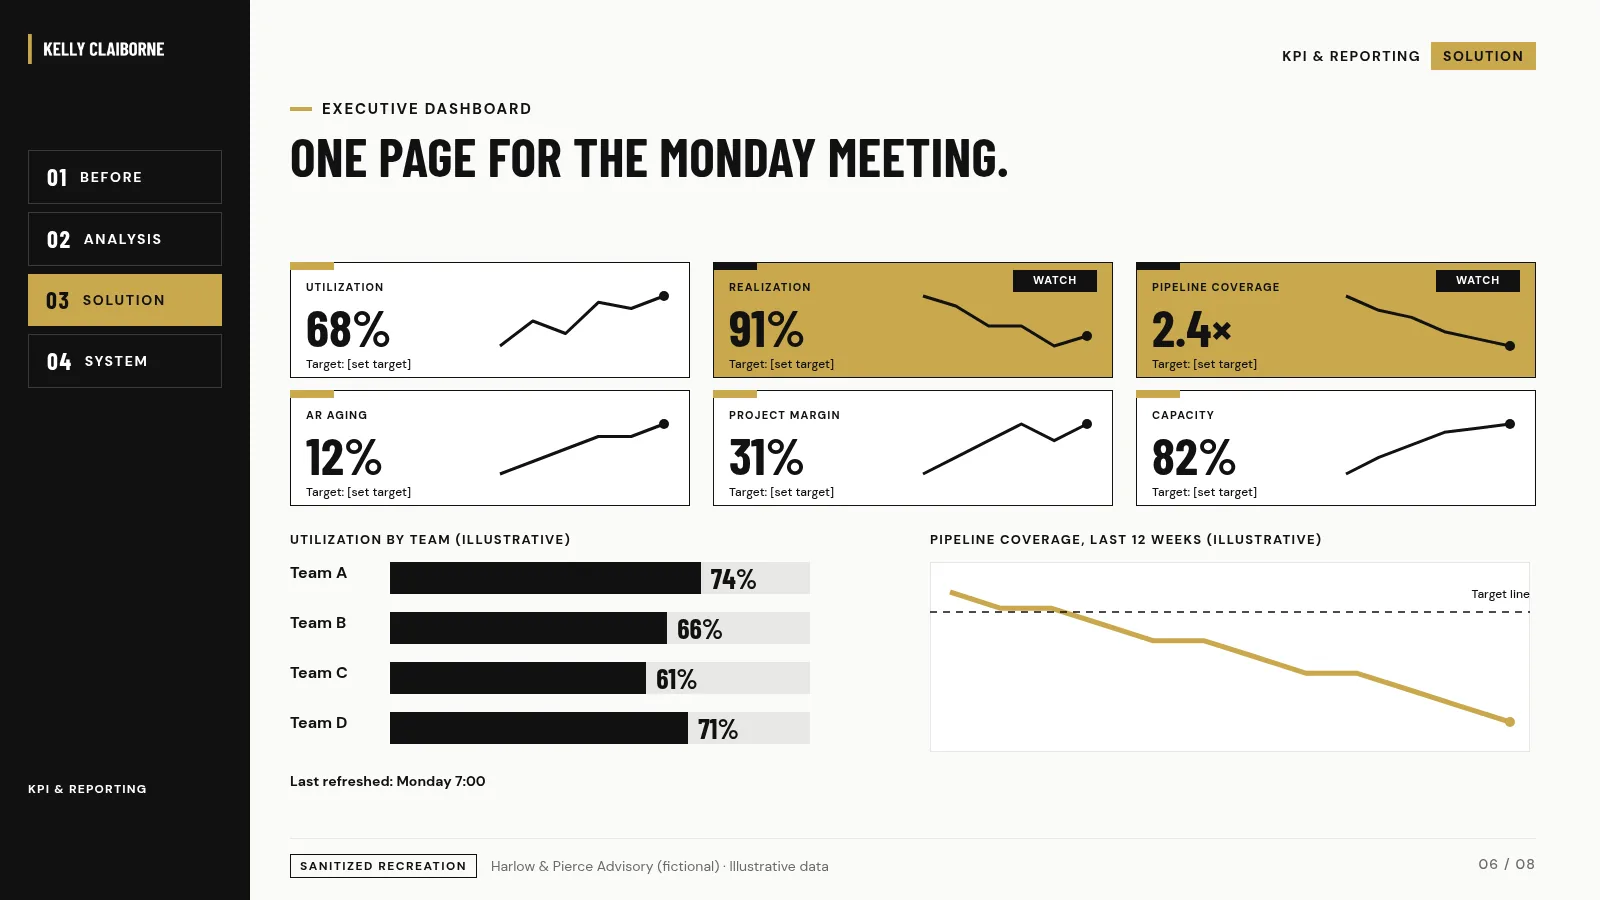
- One-page executive dashboard
- Monthly management report pack template
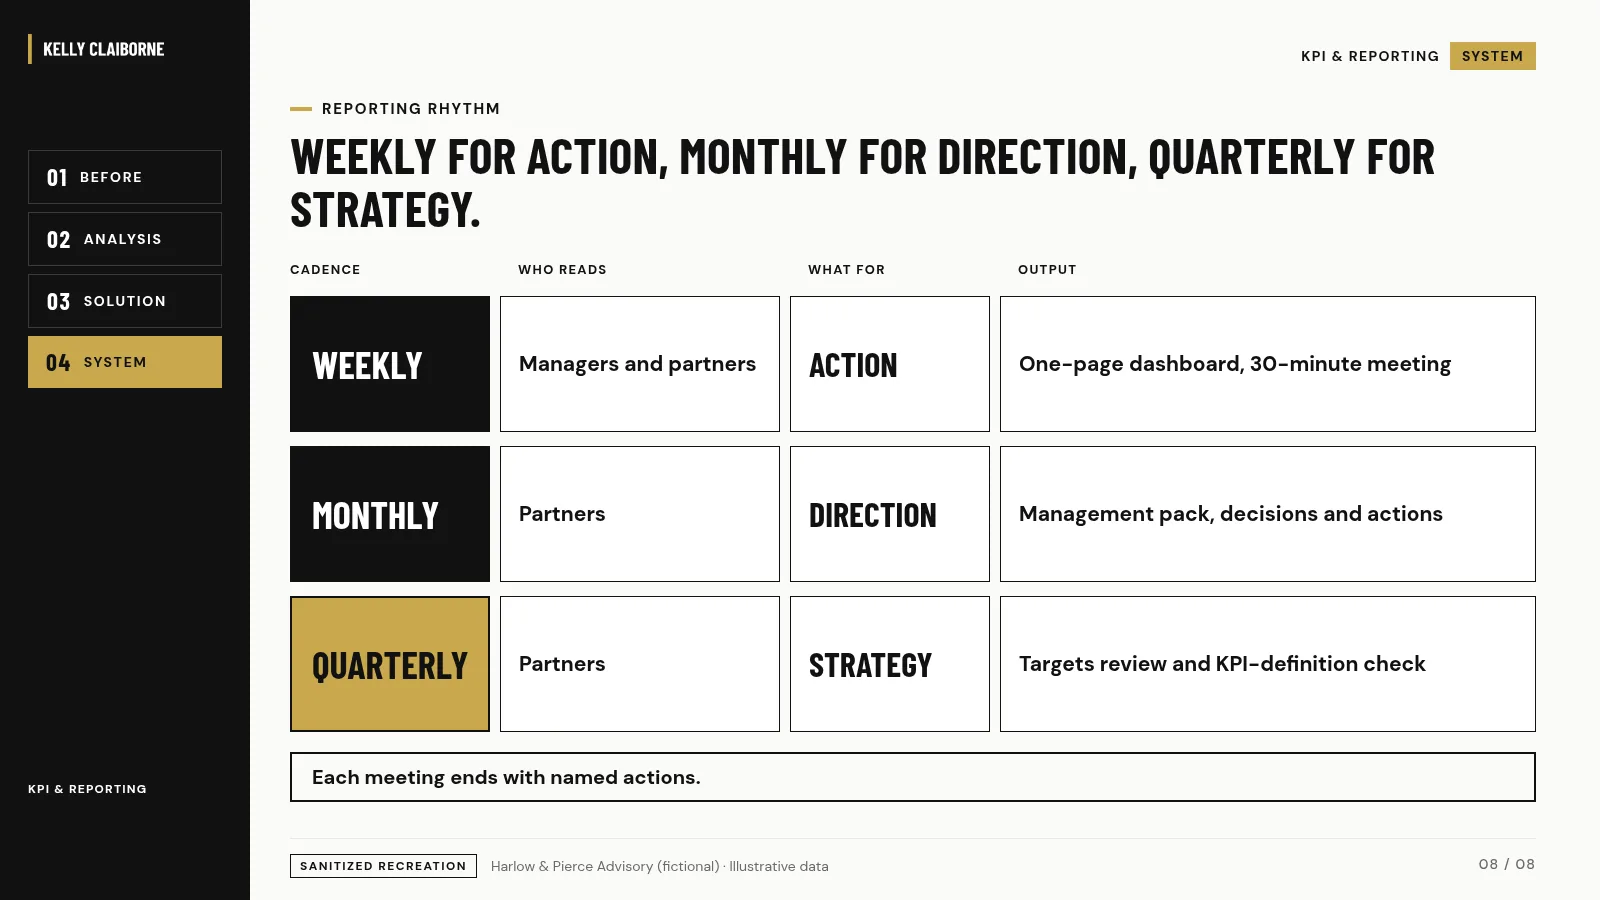
- Reporting calendar and data-quality checklist
Walkthrough
More from Where It's Breaking
WHERE IT'S BREAKING
Operations Review and 90-Day Plan
What to fix first, in what order, and who owns it.
WHERE IT'S BREAKING
Project-Management System Redesign
One home for projects, one template, statuses that mean something.
Bring me the problem
Have a problem like this one?
Book the free 15-Minute Systems Fit Call. I learn what you need and how you want to solve it, tell you whether and how I can help, and if it is a fit you get a fixed-scope proposal.