
Sanitized recreation Systems Setup and Cleanup
Reporting
KPI Dashboard and Management Reporting
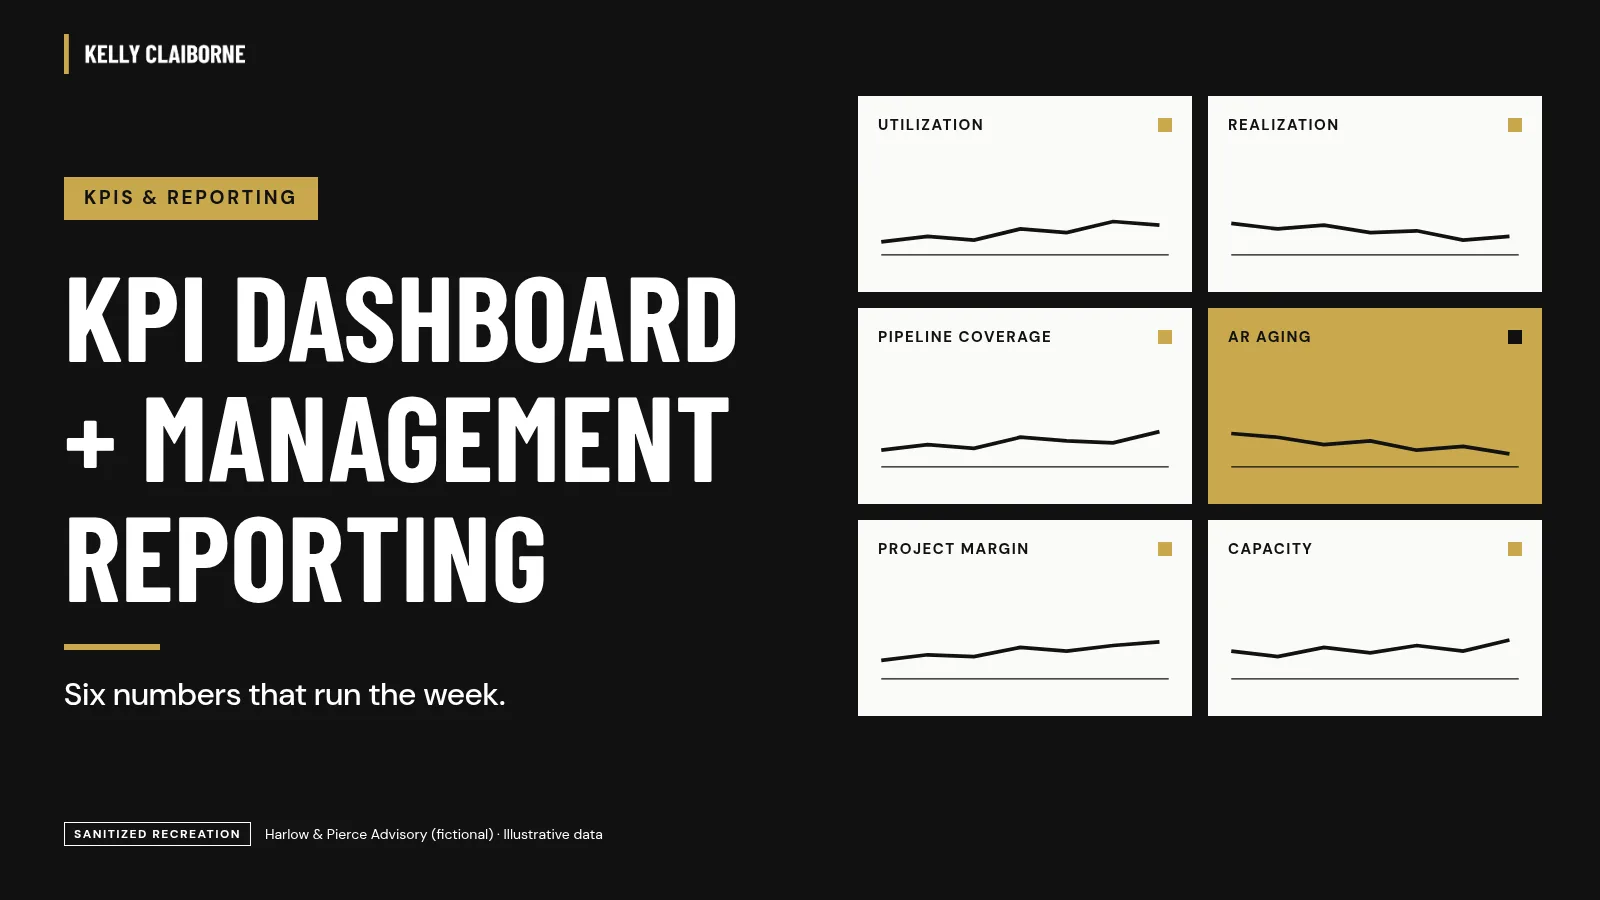
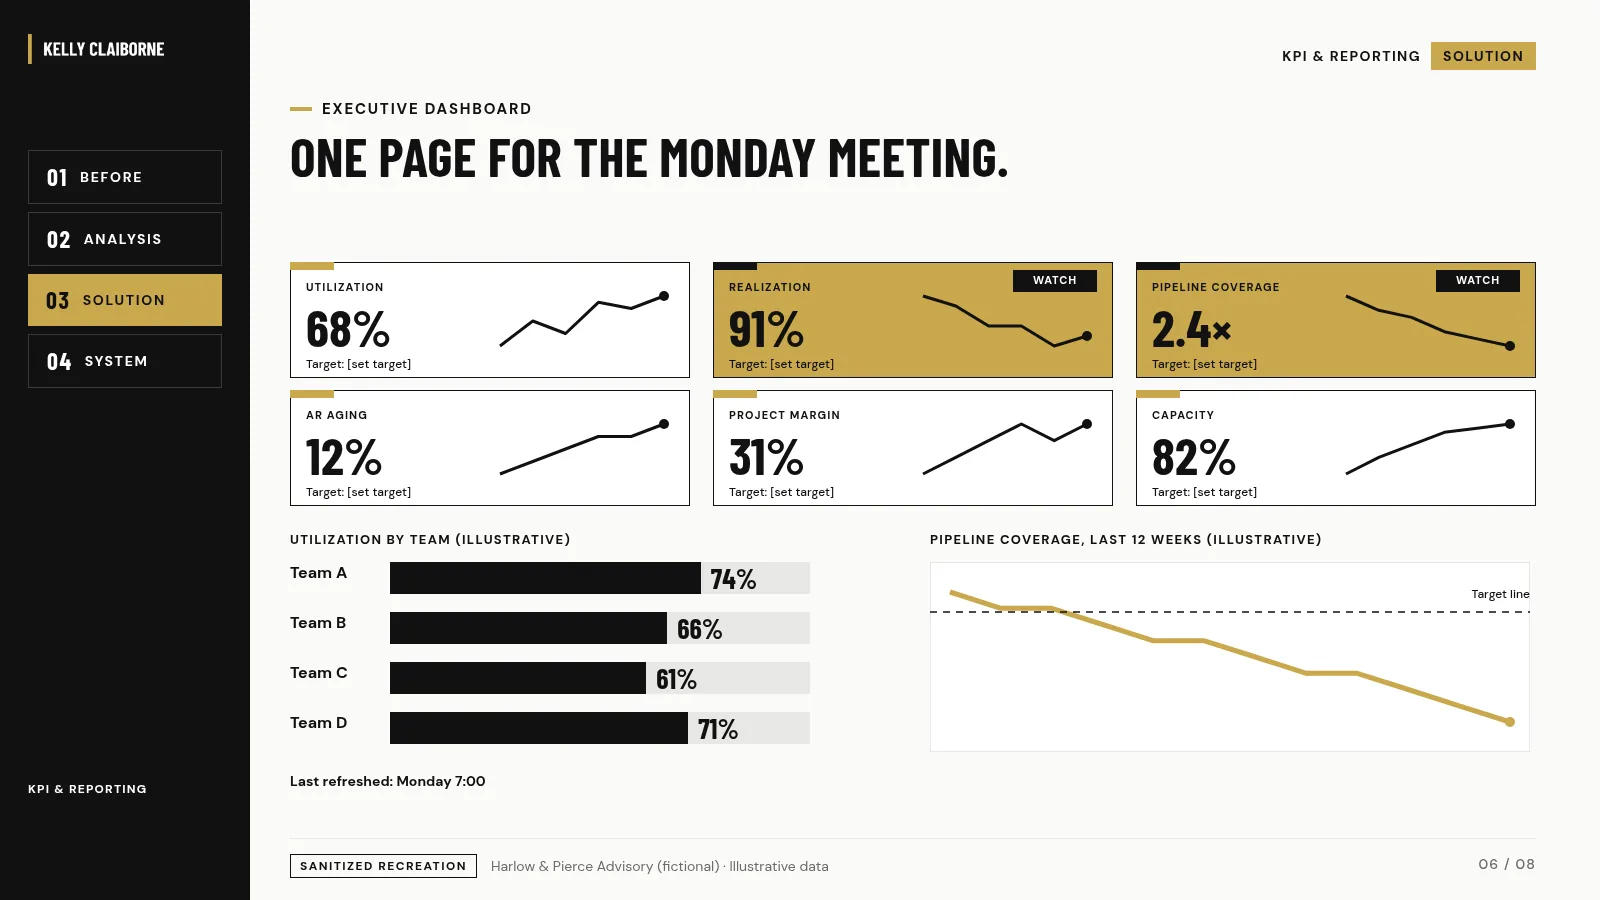
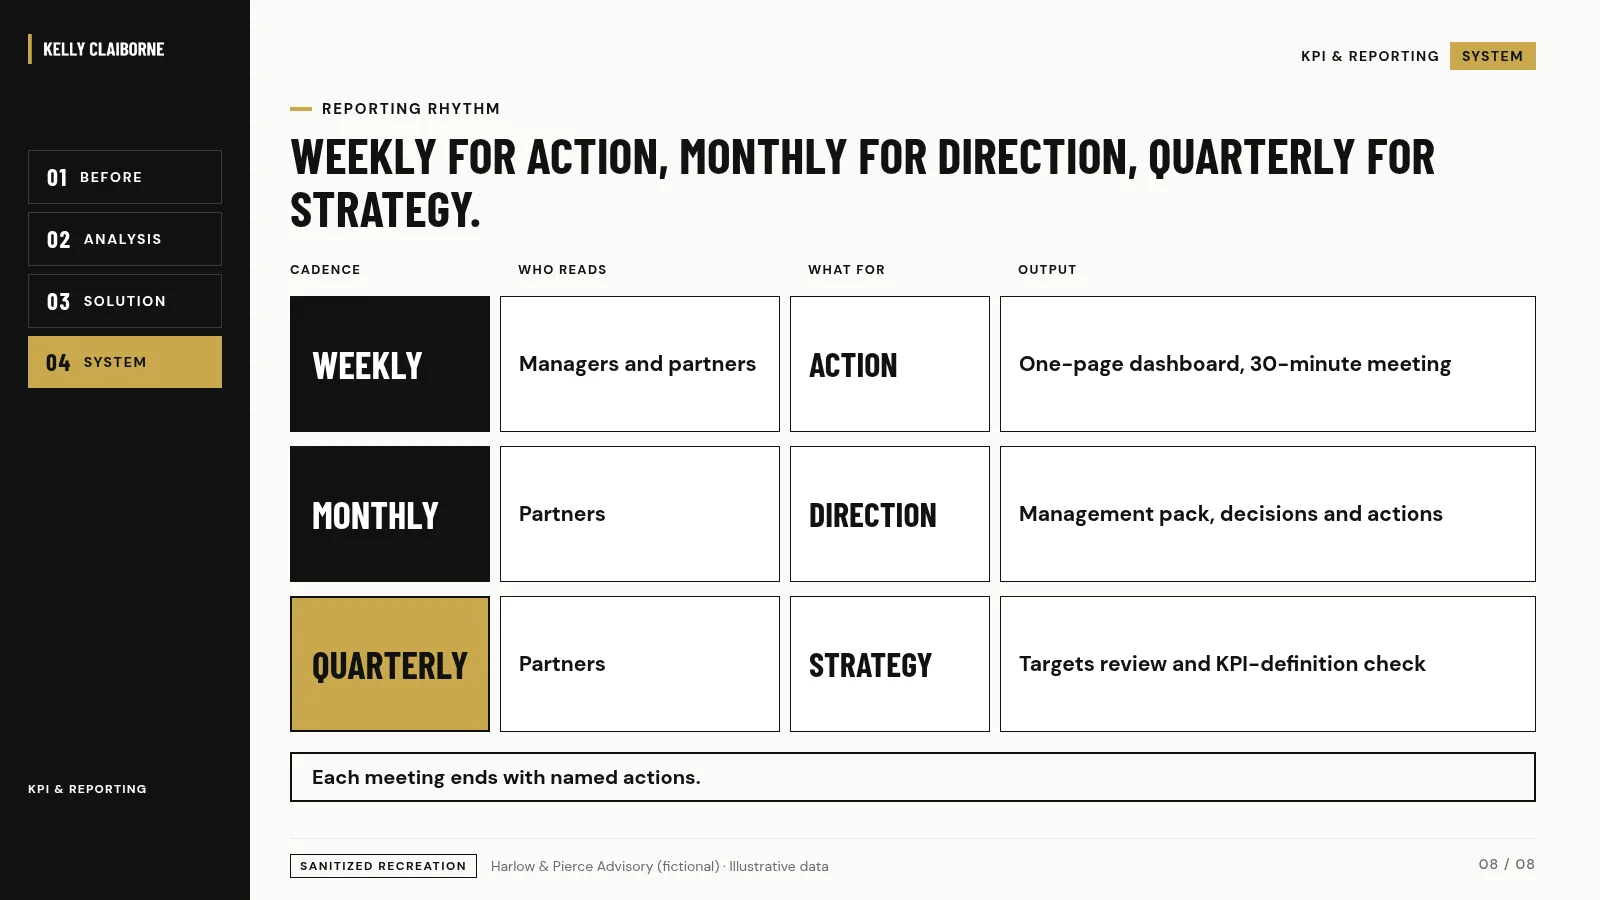
A dashboard full of numbers is not management reporting. This recreation starts with the decisions leadership makes, picks six KPIs with written definitions, maps each to its source system, and builds a one-page dashboard, a monthly pack that ends in decisions, and a weekly, monthly and quarterly reporting rhythm.
Harlow & Pierce Advisory (fictional) · Illustrative data. A fictional company and fictional data, built to show the same type of work Kelly has really done.
The scenario
- A 28-person advisory firm with two partners, six managers and a billing coordinator (illustrative).
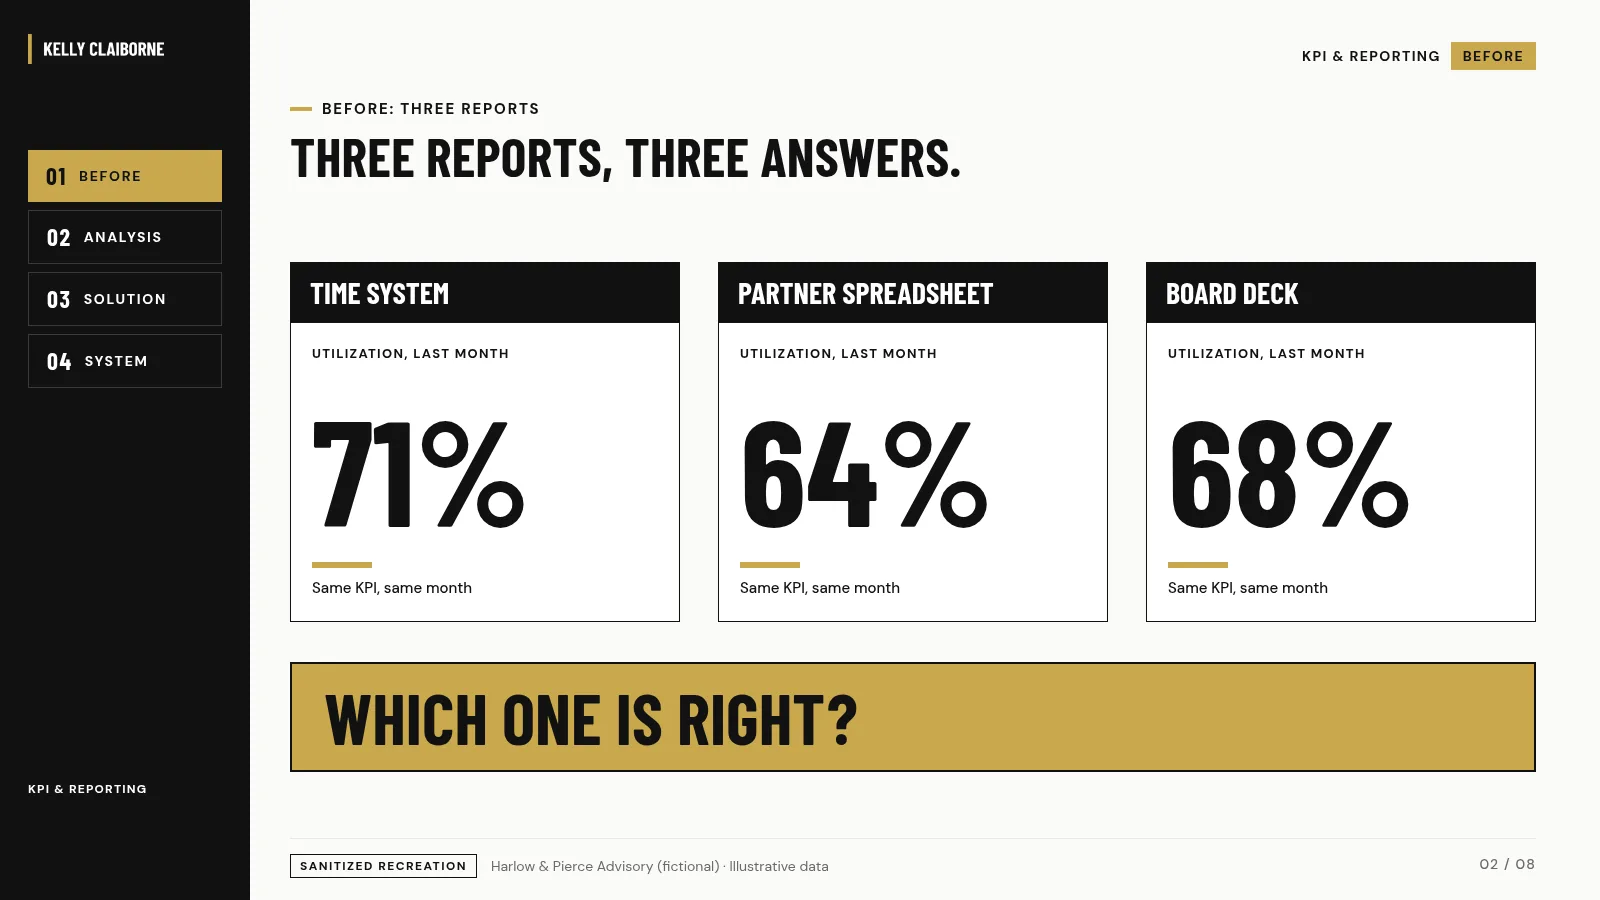
- The same metric is calculated three ways in three places.
- Project margin is known after a project closes, not while it runs.
- Monthly reports are built by hand over several days and read by few.
- Meetings spend the first half of the hour reconciling numbers. Nobody owns data quality.
The ask: “Give me one page I trust on Monday morning, and a monthly pack that tells me what to decide.”
The approach
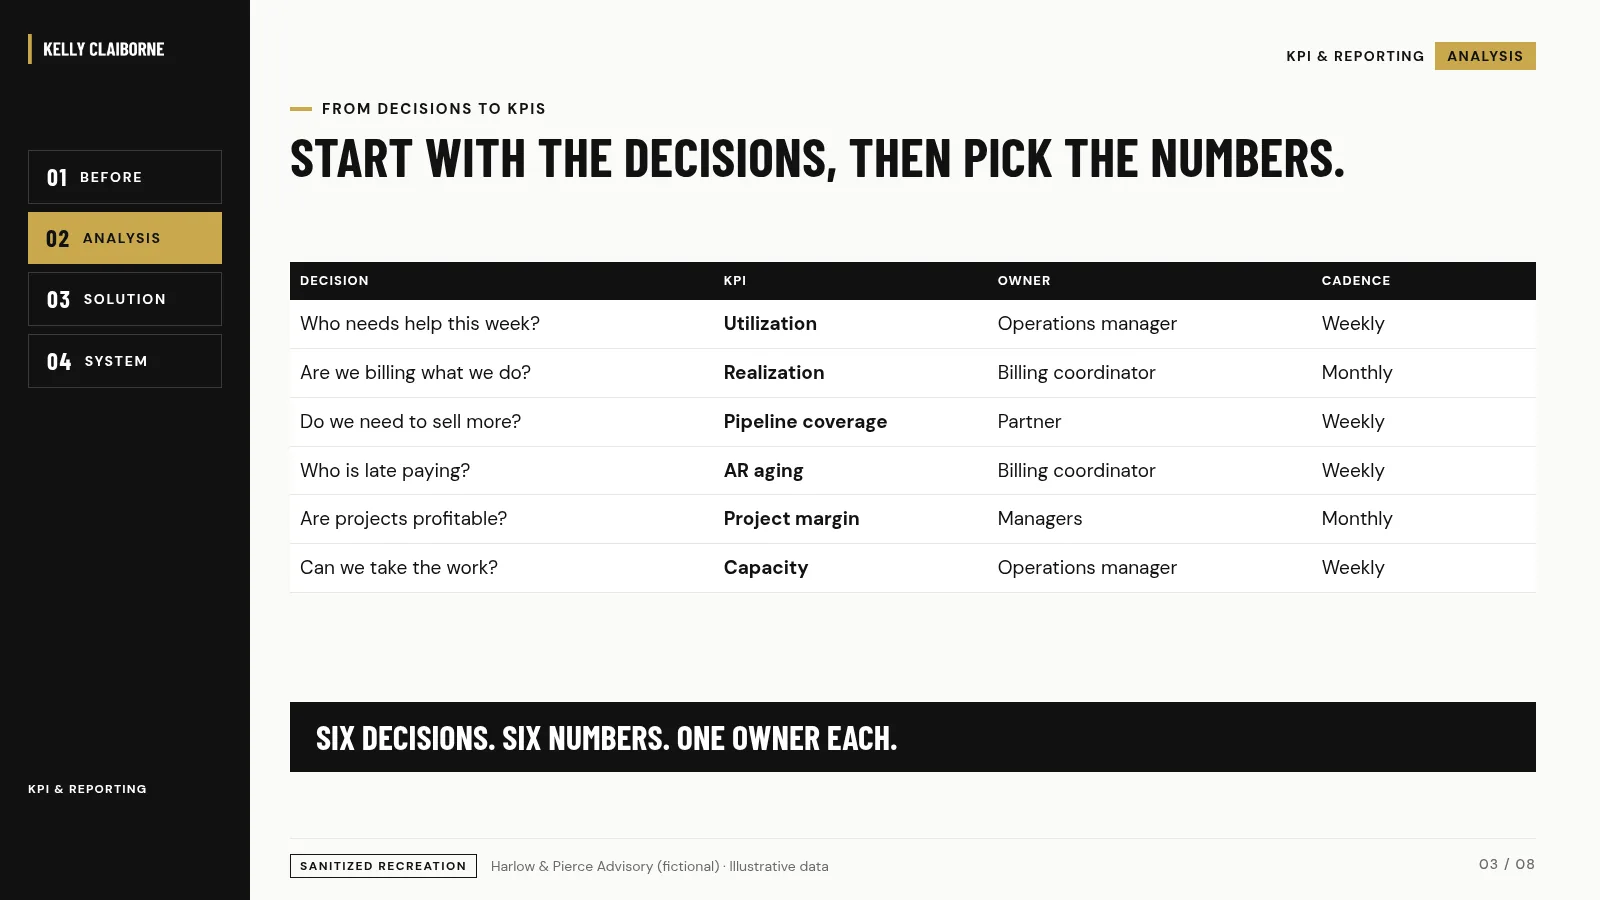
- Start with the decisions. Each KPI exists to inform one of them.
- Pick few KPIs and name one owner for each.
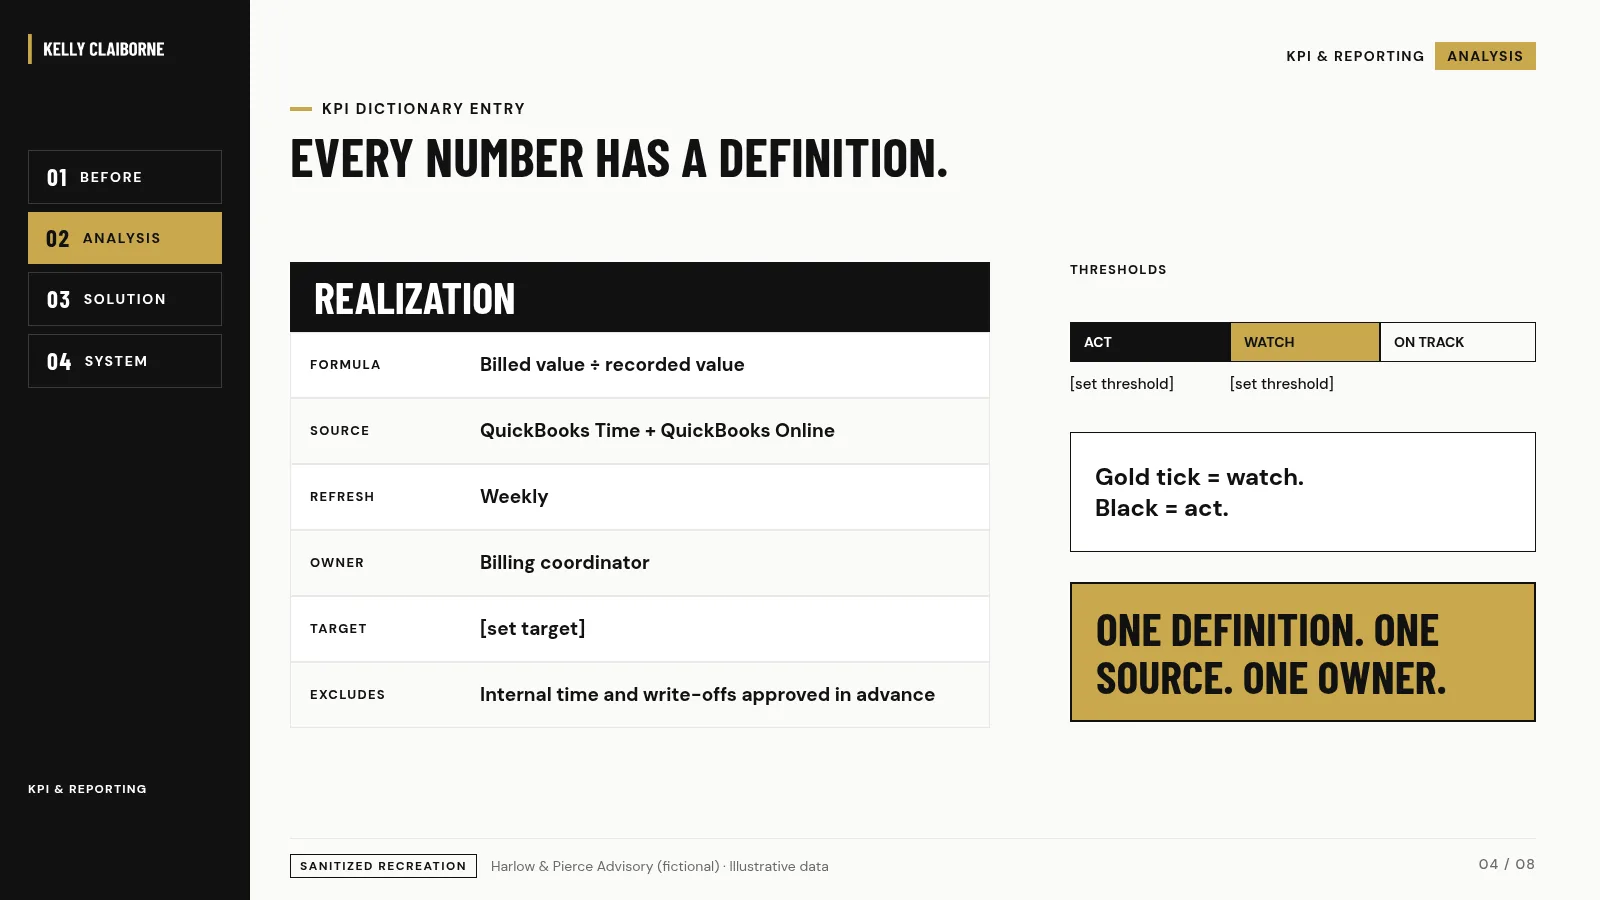
- Write a definition for every KPI: formula, source, refresh, owner and what counts as “watch” or “act.”
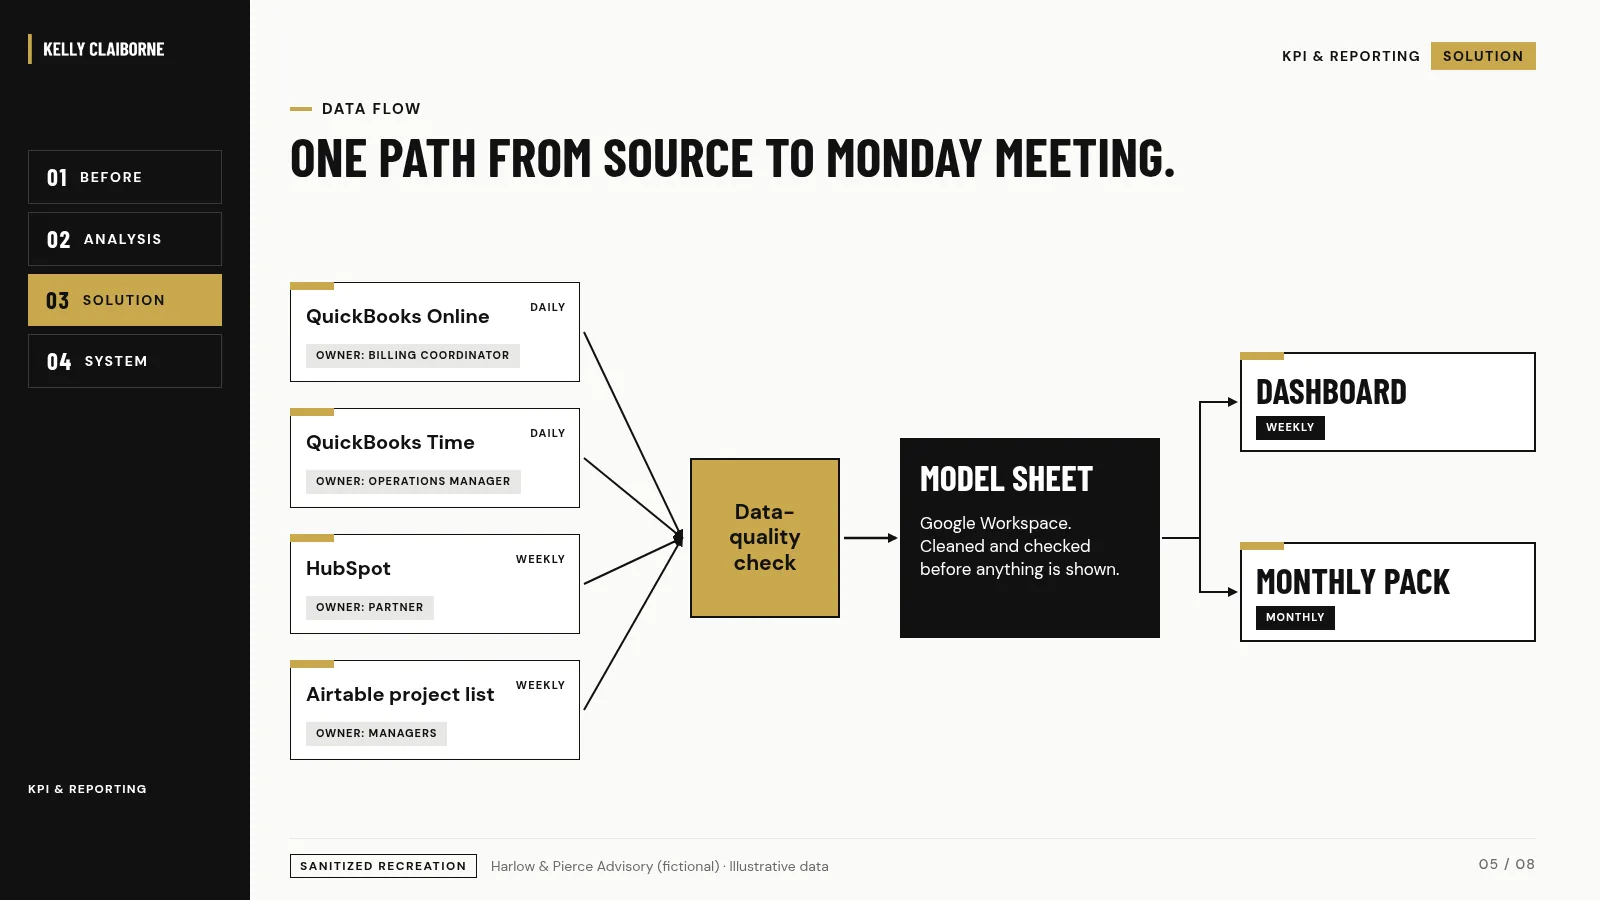
- Map the data flow from source systems to a cleaned model to the dashboard.
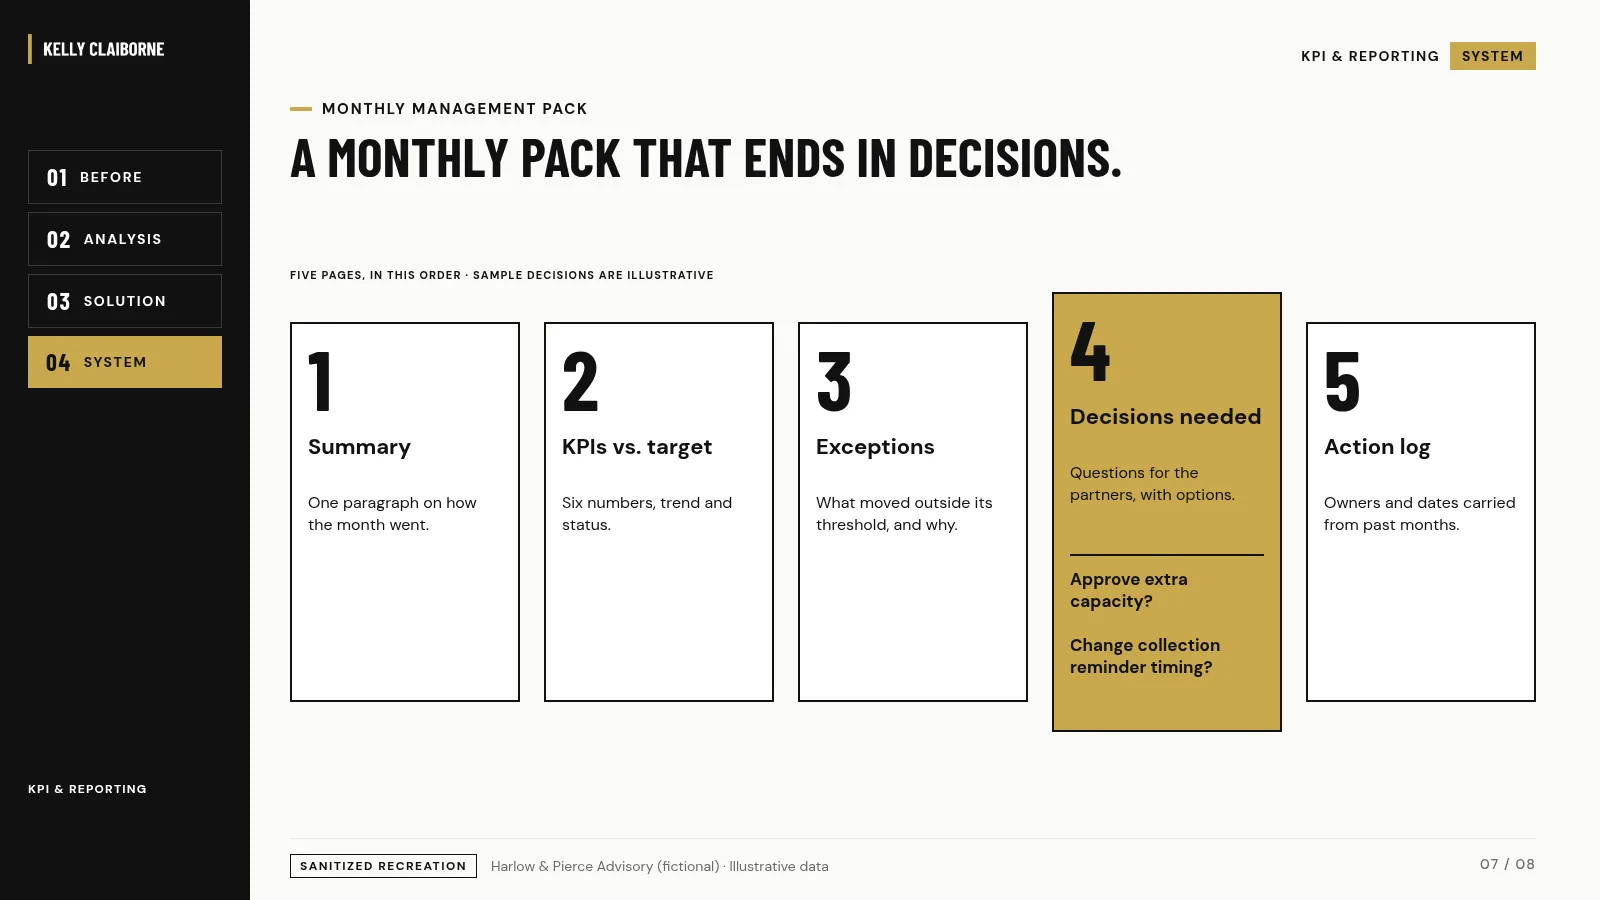
- Build the monthly pack to end in decisions and actions, not just charts.
- Keep it maintainable with a refresh guide and a monthly data-quality check.
Deliverables
- Decision-to-KPI map
- KPI dictionary (one page per KPI)
- Data-flow diagram and source map
- One-page executive dashboard
- Monthly management report pack template
- Reporting calendar and data-quality checklist
What is real here
Kelly has built KPI dashboards, scorecards and operating reports on project performance, lead quality, costs and productivity, and has worked in QuickBooks Online, QuickBooks Time, HubSpot, Airtable and Google Workspace. The firm, KPIs and numbers shown are fictional.
Service path: Systems Setup and Cleanup
Related: Growing a contractor business
The storyboard
Harlow & Pierce Advisory (fictional) · Illustrative data. Images are 16:9 slides from the sample project.
More projects
Business Operations Audit and 90-Day Roadmap
What to fix first, in what order, and who owns it.
Founder Dependency Audit
Decision rights, delegation and backups so the owner can step away.
Bring me the problem
Have a problem like this one?
Book the free 15-Minute Systems Fit Call. I learn what you need and how you want to solve it, tell you whether and how I can help, and if it is a fit you get a fixed-scope proposal.